Graphly
A personal data visualisation tool for creating metrics, logging entries and exploring the data through interactive charts.
Built with Next.js and Server Actions to keep frontend and backend in a single project. Clerk handles authentication, Drizzle ORM and Neon provide typed access to the database, and Shadcn/UI speeds up building the interface.
Stack
Next.js · Neon · Drizzle ORM · Clerk · Tailwind CSS · shadcn/ui
Screenshots (09)
Sign-in screen.
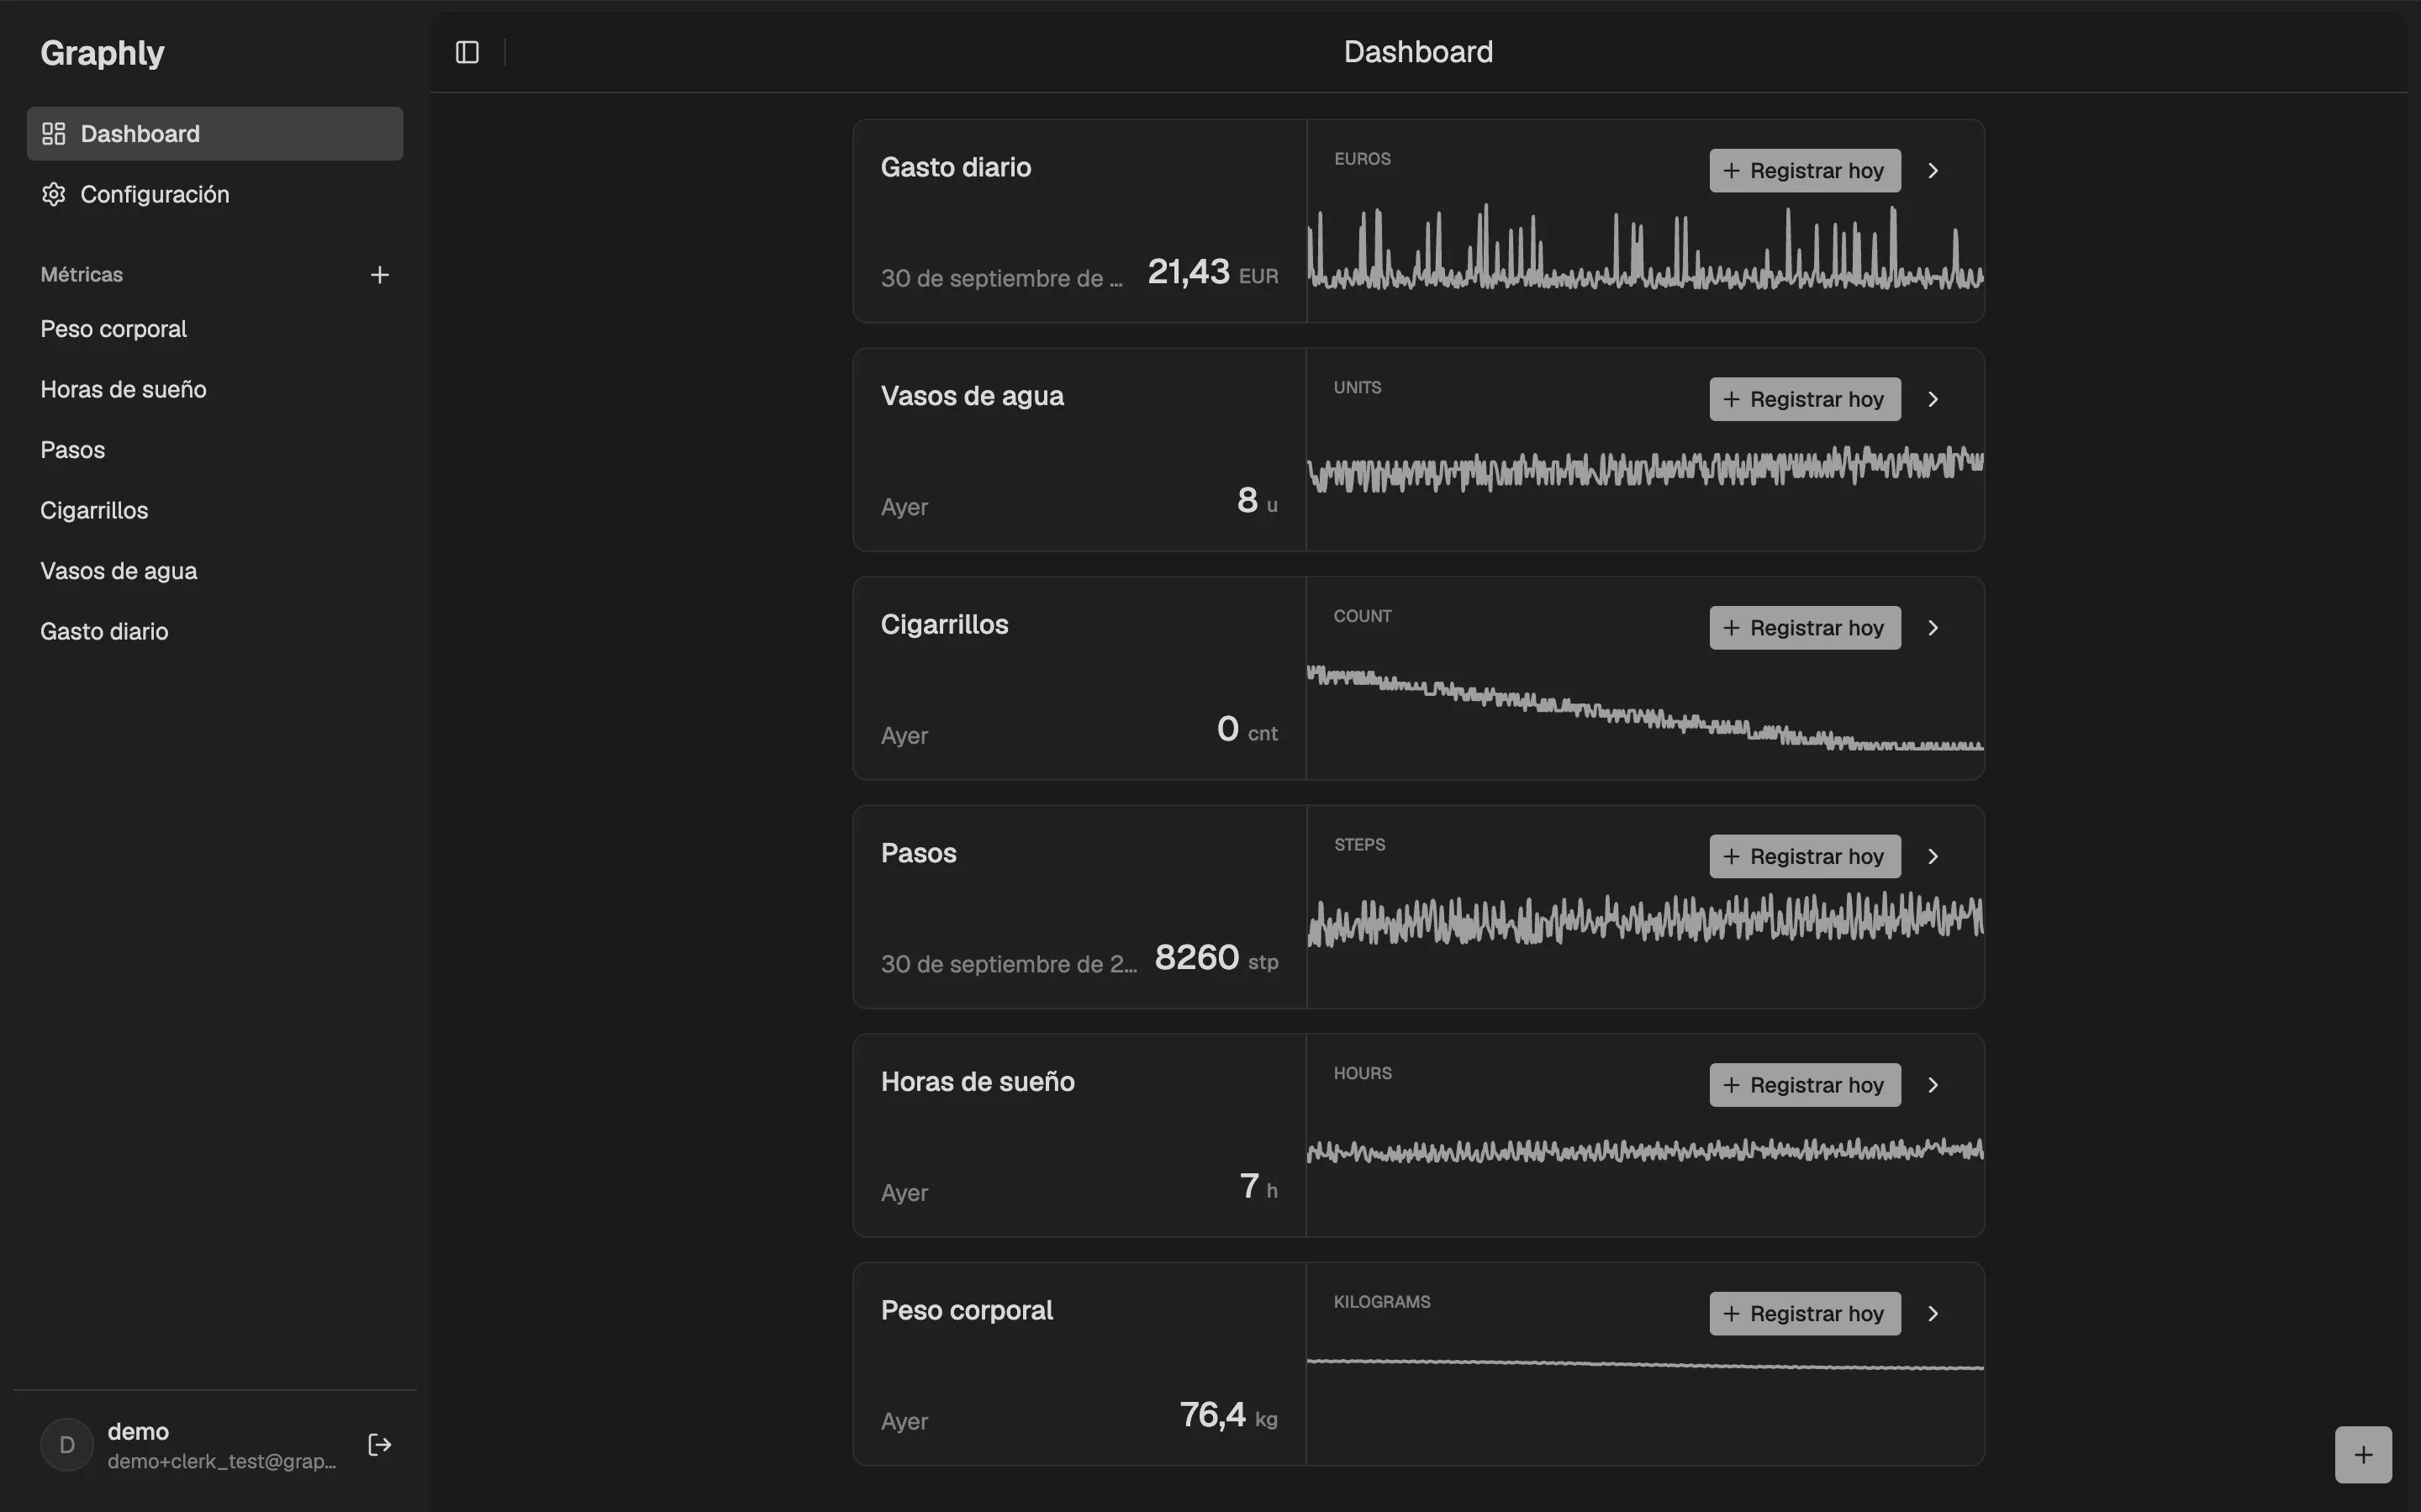
Main dashboard with every metric and its latest logged entry.
Logging today's entry straight from the dashboard.
Metric detail, with its interactive chart and the date range filters.
Filtering by a custom date range.
Logging an entry with an earlier date.
Editing an entry that was already logged.
Metric creation form, with its description and unit of measurement.
Time zone, theme and language settings.